5 Smartest Infographics Explaining Insurance
Like many of life’s necessities, the concept of insurance for your home, your vehicles and even your very life is a complicated one, requiring us to hunker down and research each time we consider a change to an insurance policy. While the internet has replaced libraries when it comes to cracking the books, finding the right information in an easily digestible format can still be a challenge that takes up more of your time than you may like.
Enter the infographic, that wonderful combination of text and imagery that has emerged over the past few years as a platform for quick and simple visualization of a given topic, leading to a better all-around understanding. Here are five of the smartest infographics explaining insurance in particular:
1. Good Drivers, Bad Drivers

Just why exactly are we all required to purchase auto insurance before we’re legally allowed to hit the road? With billions of vehicles moving from place to place all over the planet, the variety of drivers out there ranges from polite and safe to wild and dangerous, meaning that everyone everywhere is at risk of an accident.
This infographic takes at look at the habits of drivers straight from their mouths, relying on honest self-reporting to give a stark look at what you’re up against every time you pull out of your driveway.
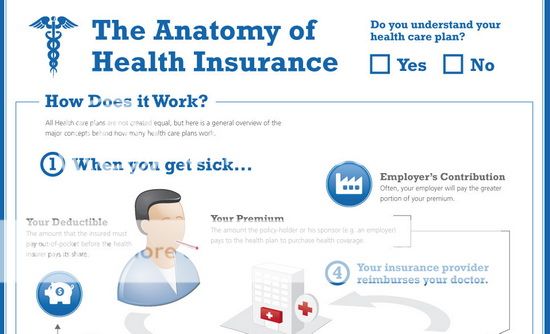
2. The Anatomy of Health Insurance in the United States

The American health insurance industry is a massively complicated beast, providing coverage for health care costs to millions while presenting policyholders with an almost unending array of opt-in and opt-out opportunities for coverage for particular situations and ailments. With coverage coming from a combination of the government, your employer and your own savings, it seems very few Americans can claim to truly understand the way that their health insurance works and to what extent they’re covered.
This highly detailed infographic offers an overview of just how complicated health care is in the United States, providing in-depth information on HMOs, PPOs, and all of the other curious variables that come into play in determining the details of your health care coverage.
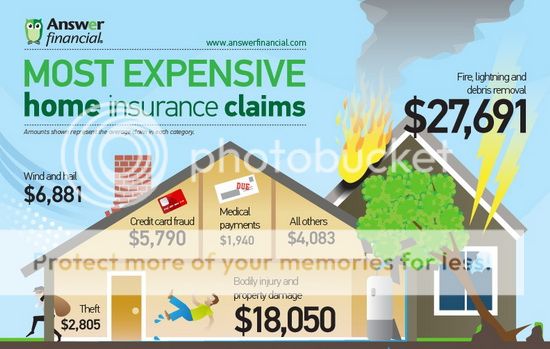
3. Most Expensive Home Insurance Claims

Purchasing home insurance means more than just covering the structure in which you live; it also means covering the wide array of items contained within it. While maintaining coverage as a homeowner is a no-brainer – not to mention generally required by law – the type of policy that you hold requires that you understand just what you’re covering.
This infographic explores the most expensive types of home insurance claims; you may be surprised at the type of claims that top the list!
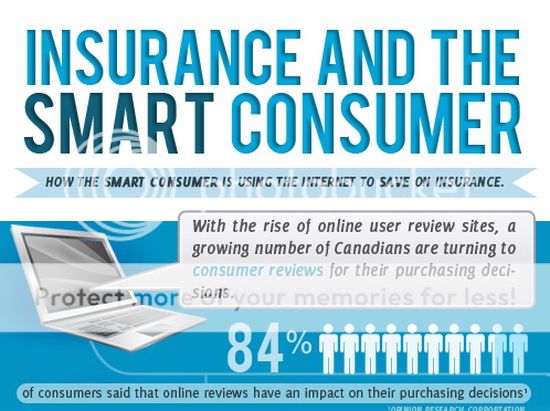
4. Insurance Trends in Canada

Focusing on the trends of insurance policyholders in a particular region can help you to better recognize your own needs and shortcomings where insurance is concerned, acting as a measuring stick by which to determine the policies that fit the products and properties that you purchase throughout your life.
Whether you live in Canada or not, this interesting infographic offers the ability to compare your experience with insurance to those around the country or around the world, helping you to get a better handle on the policies you pay for.
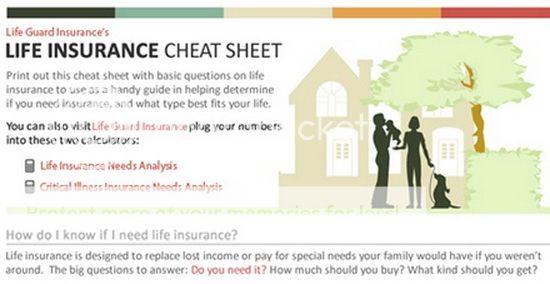
5. Life Insurance Cheat Sheet

Being able to answer a series of questions about your life and your needs is the very first step in obtaining life insurance, allowing you to determine the best policy for you with the coverage that your family needs.
This infographic aims to act as a life insurance cheat sheet, helping you to more easily identify the variables that will help you to decide how to proceed in getting yourself covered.
Aimee is the creativity blogger for autoinsurancequotes.net. Aime loves visualization methods, graphic design, etc.
Image Credits: 1, 2, 3, 4, 5.
When it comes to buying insurance, consumers continue to prefer brand over price as well as rely on personal interaction. Most of the time, they only use online channels to get a quick overview or comparison.
5 Smartest Infographics Explaining Insurance.